Reporting on Ranking Changes with STAT’s Google Data Studio Connectors

Reporting on Ranking Changes with STAT’s Google Data Studio Connectors

Reporting on Ranking Changes with STAT’s Google Data Studio Connectors 1920 1280 Ian Pfister

Since Moz released the new Google Data Studio Connectors for STAT, you might be wondering how to best implement them for your reporting strategy. My colleagues at Path Interactive and I absolutely love how granular you can get with your reports in STAT, and finally having the ability to cleanly and effectively pull those reports into Data Studio (the tool we use for our own reporting) is a godsend.

While the Historical Keyword Rankings connector reports on rank over time, it may not be as obvious how to report on rank change over time. In this post, I’ll give you step-by-step guidance on how to report on rank change — as well as a couple other filtering and reporting tips — while using the connectors within Google Data Studio.

If you aren’t a STAT user yet but you want to know how it might fit into your SEO toolkit, you can take a tour of the product. Click on the button below to set one up!

Connecting your data source

Before you begin, you need to identify a few things to set up the connector: your STAT Keyword API Key, the Project ID, and your Site ID. If you don’t already know how to identify these via the STAT API, you can head over to STAT’s documentation here to learn more. After you’ve identified these, it’s time to connect your data source. 

We’re going to be doing something a little out of the ordinary here, but stay with me — you’ll see why in just a second!

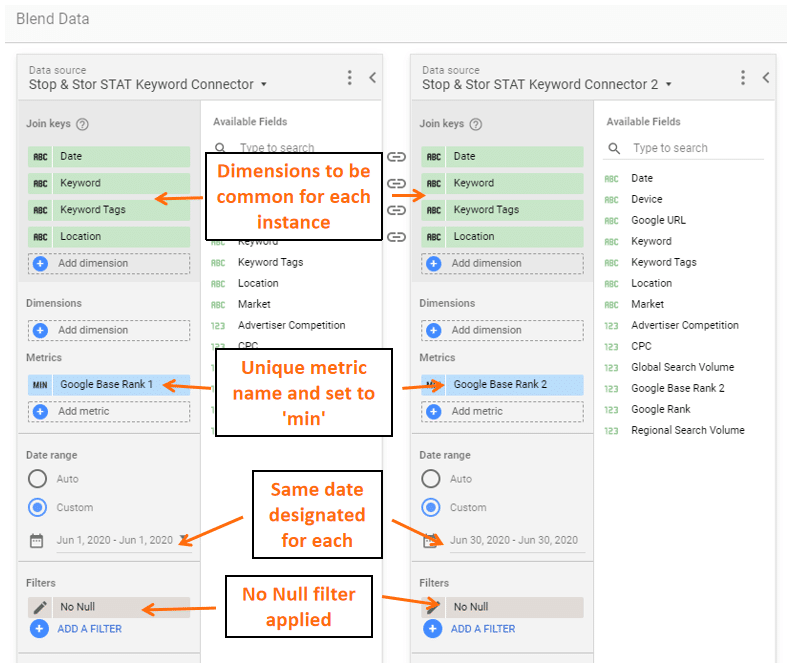
For this step, we’ll be connecting two instances of the same source. Because our goal is to compare rank change over time, we’ll use the same source twice to identify those deltas.

When setting up your connector, be sure to name the source something that you’ll easily recognize:

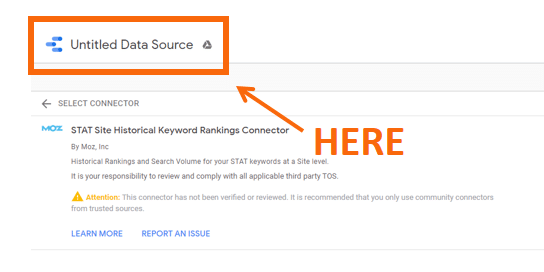
In my case, I usually go with something simple such as “[client name] STAT Keyword Connector.” When this is complete, repeat the step above, but name it something different, e.g. “[client name] STAT Keyword Connector 2.”

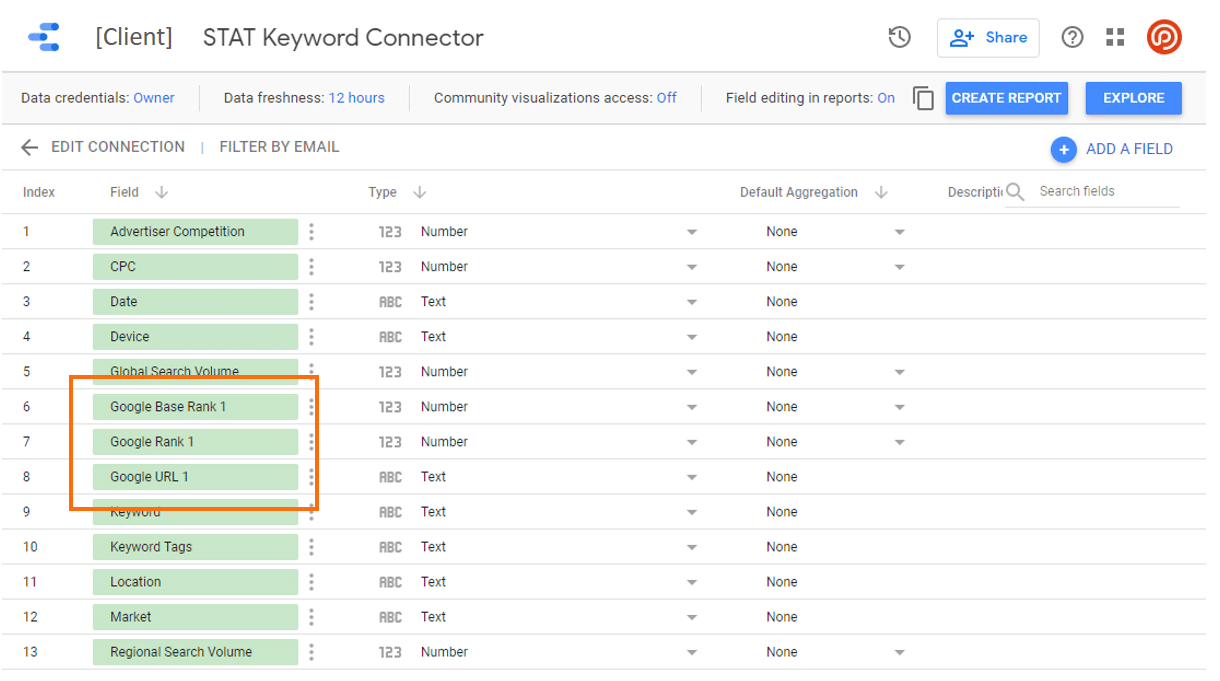
Finally, make sure the metrics you plan on comparing have unique names for each connector. To do so, go into your data source. Click on the metric’s name so that you can rename it, and then rename it something unique. For this case we’ll be doing it for “Google Base Rank,” since we’re comparing ranks, but it can also be done for “Google Rank,” if we wanted to compare that. Again, I like to just keep it simple: for the first data source call it “Google Base Rank 1,” and then for the second data source call it “Google Base Rank 2.” When all is said and done, it should look something like this:

Building your table and blending data

Now we’ll start to get a bit more technical. Blending the data of the two connectors lets you compare two instances of rankings against each other. Your final result will produce a table showing the ranks of two given dates, as well as their rank change. The five-step process will look like this:

  1. Blend data of keyword connectors one and two
  2. Add in your common metrics for the two sources (keyword at the minimum, but you can also add in location, device, market, and search volume)
  3. Add in the metric you’d like reported (Google base rank and/or Google rank)
  4. Set date range
  5. Apply “No Null” filter

1. Blend data of keyword connectors one and two

The first step here is to blend the two connectors so that you can compare two instances of ranks against each other. 

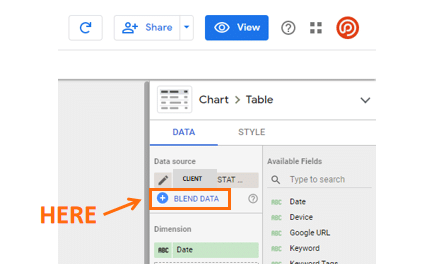
First, you need to create a new report, or go into a report that’s already set up. Next, select your data source. Here you’ll select the first instance of the source that you set up earlier (if you’re starting on a fresh report, it’ll ask you to add a data source immediately). Once selected, click on “Blend Data” underneath the data source on the right hand side of Google Data Studio, seen here:

This will bring you to the Blend Data source tool. From here you select to add another data source, being your second instance of the connector.

2. Add in your common metrics

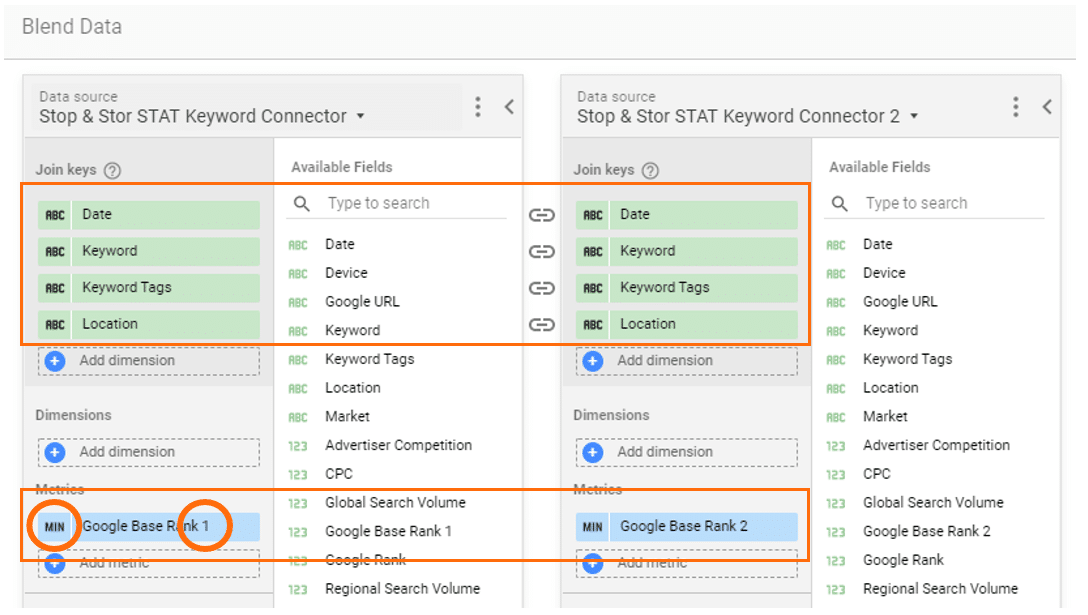
Once you’ve chosen to blend both connectors, you need to set your metrics. Towards the top, you’ll see “Join keys.” This is in reference to what’s going to be the same for both instances, so here at the minimum, you want to include “keyword.” Feel free to play around here with adding different metrics.

Note: We’ll go over this later, but if you plan on having different graphs filtered by a certain tag or location, make sure to add these in here.

3. Add in the type of rank you want reported

After setting your metrics under “Join keys,” now select the metrics that will be unique for each date. Depending on what you want to compare, under “Metrics” you’ll pick “Google Base Rank,” “Google Rank,” or both. You may also include “Date” here too if you’d like. Once done, click on “SUM” next to the metric name, and change this to “MIN.” You’ll see why in just a moment.

At this point, your blended data should look something like this:

4. Set date range

Now you need to set the two date ranges you’re comparing to each other. 

To do this, under the first connection, set your first date: Under “Date Range,” click on “Custom,” then click on the field to select your date. Here you might see that there’s an option for two dates, but for this solution, we’re using the same date for each connector.

In the end, it’ll be something like “Connector 1” selected for the “start date” and “end date” as the first of the month, and for “Connector 2,” the “start date” and “end date” will be the last of the month. This is essentially pulling in the rank for the first instance as well as the second instance, so you can compare the two.

5. Set “No Null” filter

The last step in setting up your blended data is creating a “No Null” filter. When the keyword connector reports on ranks that your site is not ranking for, it will return as “null.” To avoid flooding your data with fluff, you need to create a filter removing instances of “null.”

First, click on “Add A Filter” below where you selected the date range. Next, towards the bottom, click on “Create A Filter.” Set the parameters of the filter as “Exclude” > “Google Base Rank 1 (2)” > “Is Null.” Be sure to name the filter something identifiable such as “No Null.” It should look like this:

Applying rank change to your report

Now you can create a new field that will report on the rank change by making a calculated field to find the difference of the two ranks. 

Under dimensions, select “Add Dimension,” and click on “Create Field.” You can name it “Rank Change,” but to create the field, start typing “Google Base Rank,” and you’ll see your instances from each connector come up. To make the calculated field, select your “Google Base Rank 1” and subtract it from “Google Base Rank 2,” so it should look something like this:

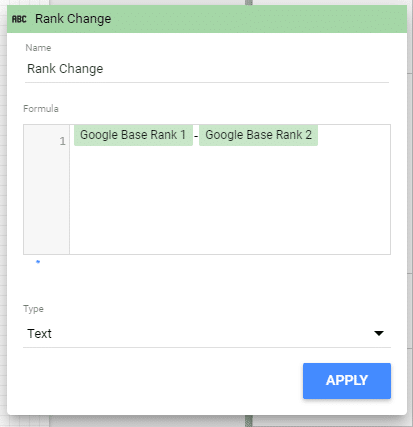
Hit apply, and now your rank change should be calculated!

There is also an additional way to get the same result, but with a few drawbacks, such as not being able to name the header, as well as not being able to filter or sort your rank change. The benefit to this approach is that it’s easier to set up initially, as you don’t actually need to blend the data. However, not setting up the blended data will also forfeit having the initial rank visible. When in your edit view, set a custom date range that you’re reporting on under “Default date range.” Here, you can then set a comparison date: if looking back a month, you can set this to the first. If you go with this option, it should look like this:

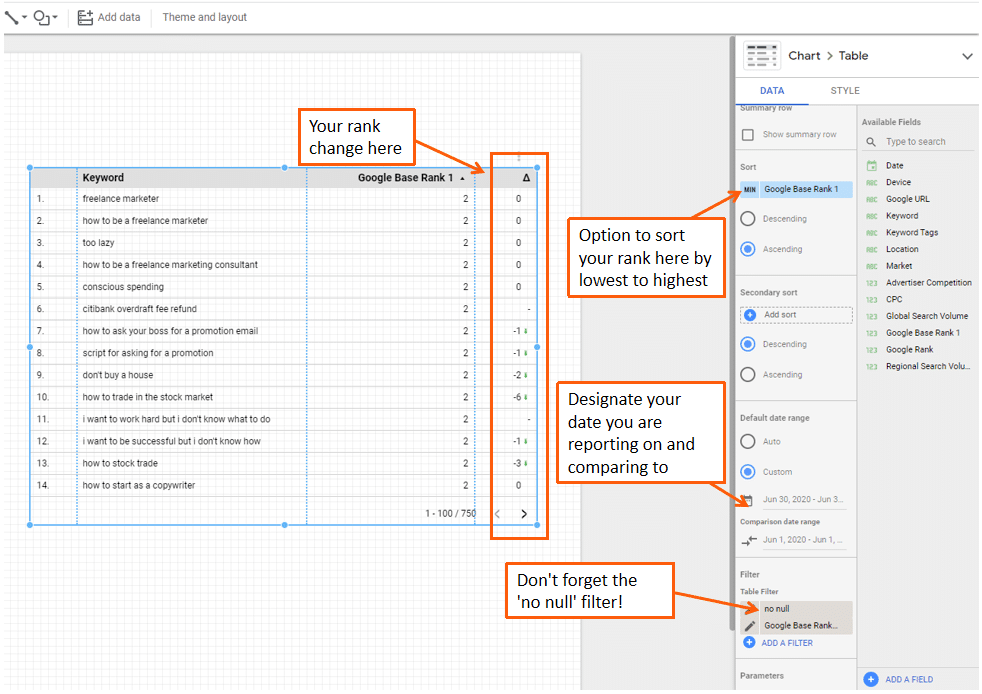
Head into the “Style” tab, where you can change the comparison to “Show Absolute Change” under “Metrics.” You can also change the colors of your positive and negative arrows to more accurately represent the movement (you can see from above that the “negative” change is a green arrow, this defaults to red).

Using filters

Applying filters to your data set can be extremely beneficial to making sense of your data! Using filters with the connector can help you segment out rankings for a particular location, or create charts that show rankings for a specific keyword group that you’ve set up using keyword tags. 

Take a look at this report I set up as an example. Within STAT, I created keyword tags to target locations determined by what zip code they were. Then, I was able to create a filter for each chart targeting that keyword tag:

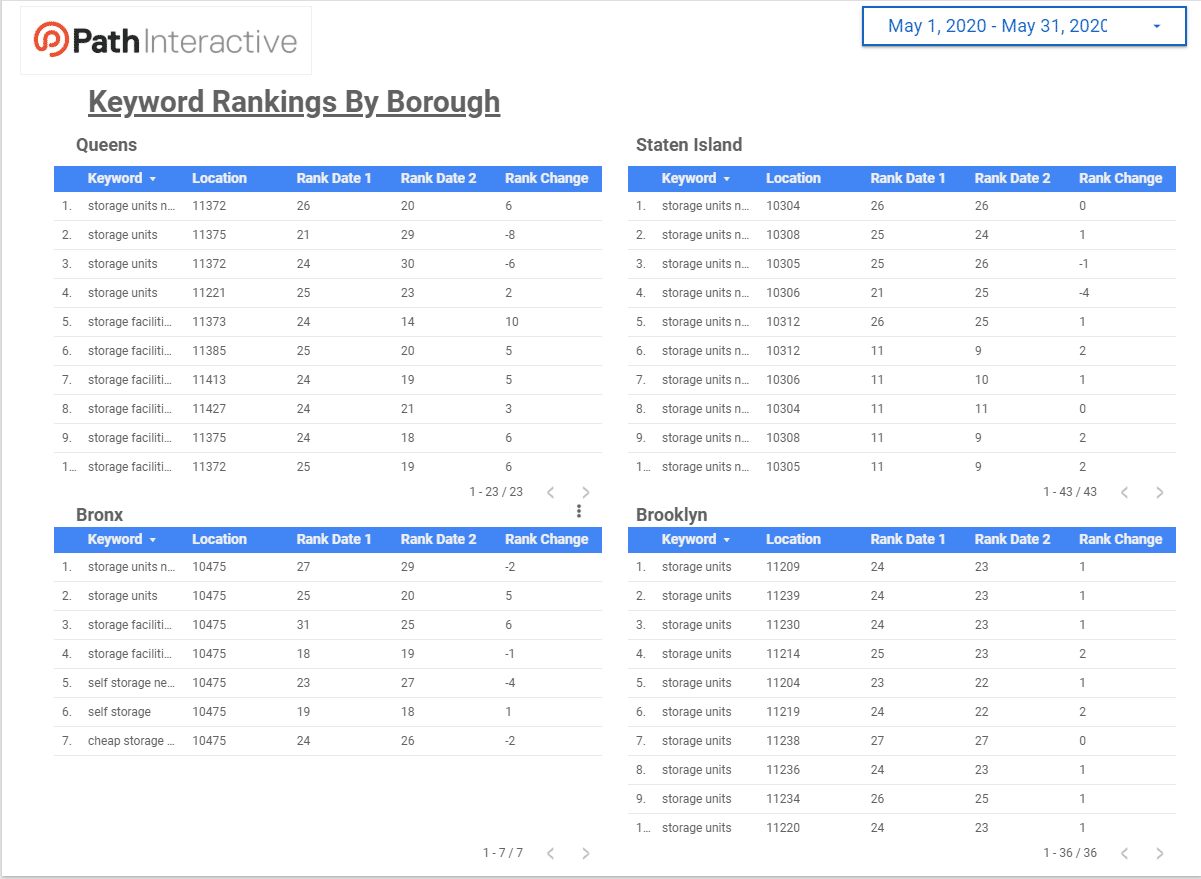
Setting filters up is extremely simple. First, go into edit mode. Next, scroll down the side until you find “Filter.” Then under Filter > Table Filter, click on “Add a Filter.” This will bring you to the filter picker. Toward the bottom, click on “Create a Filter.” Here you can set the parameters for the filter you’d like to show.

Some of my other favorites include filtering to only show the top few pages (filters out non-relevant and high ranks), using the keyword tag filter like I showed before, and also filtering by location. But you don’t have to stop there! Adding in the additional dimensions available to you in the connector, you can use the filter to show things such as desktop vs. mobile or how your keyword ranking performance does in different markets.

Blending your Google Analytics, Google Search Console, and STAT data

One of my favorite uses for the connectors is the ability to blend the data with your Google Analytics and Google Search Console data. By blending this data together, you’re able to directly tie keyword rankings with different metrics, such as clicks or goal completions.

You’re probably a pro at blended data at this point, but just for reference, the data blended should look like this:

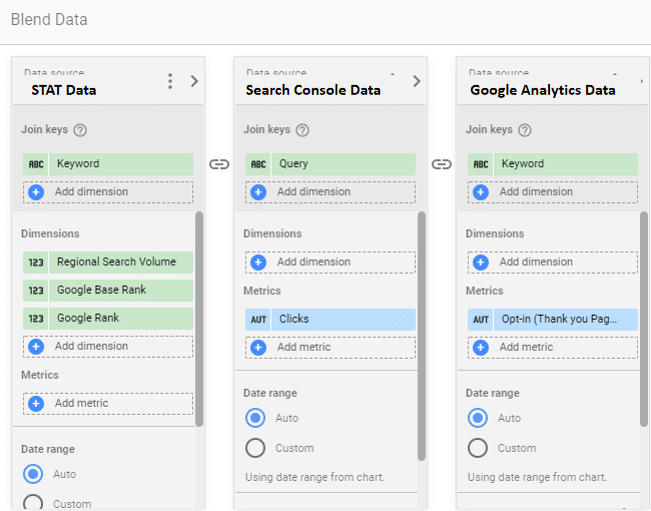
A few things to note: it’s important what order you put the connectors in. I’ve found that adding the STAT connector first works best (i.e. if you put Google Analytics first, you’ll get a report with the infamous “not found” keyword). Additionally, to pull in Search Console data in order to match with your other connectors, using “Query” will have the same effect as “Keyword.”

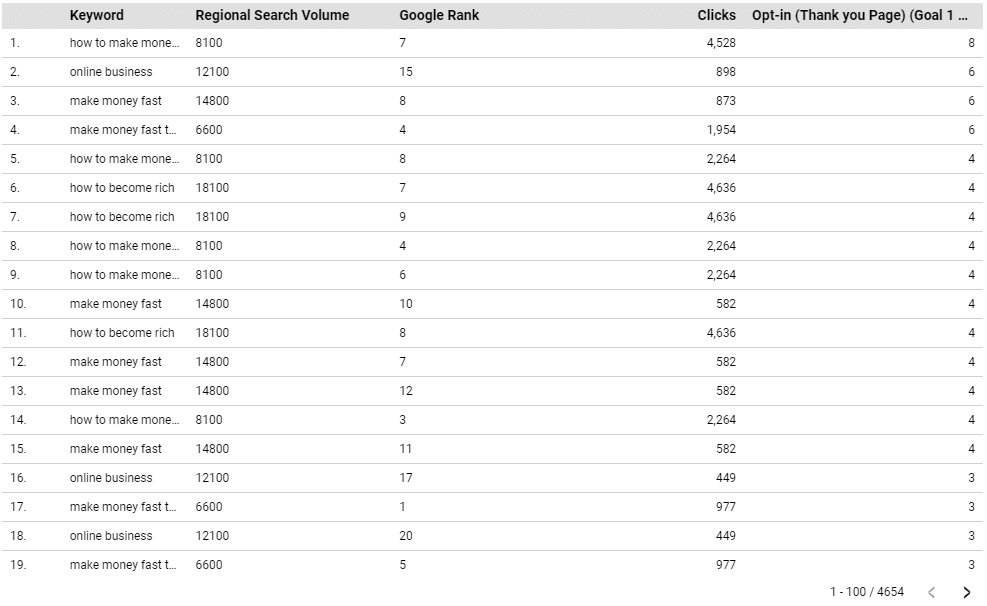
The result would look something like this, but feel free to edit the design how you wish!

Now you can go even further with this and match up URLs, but this will require some RegEx. 

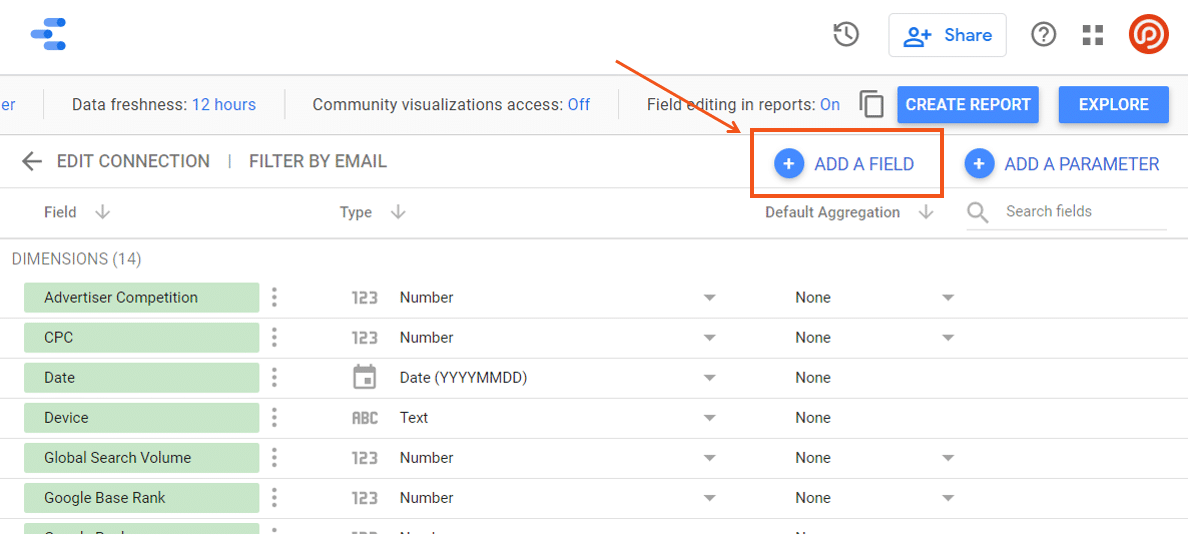
You’ll rename the “Google URL” field in STAT and “Landing Page” field in Google Search Console in order to match the URL structure convection within Google Analytics by taking out the domain portion of the URL. To do this, go into your data source for each STAT connector and Google Search Console, and click “Add A Field” in the top right.

Next, enter to following RegEx for the STAT connector:

REGEXP_REPLACE(Google URL, “.*[.]com”, “”)

And for Google Search console:

REGEXP_REPLACE(Landing Page, “.*[.]com”, “”)

Remember to name them something to differentiate from the default field. I use “Landing Page (no domain).”

When building a report, use these new fields for consistency across the URL structure so that, when you select them when blending data, they’ll match. 

Use this method in the same way as above to get the desired results of pulling in data from across all three connectors to match up with each other! In the end you should be able to find what keyword ranks for what URL, as well as have many sessions or clicks that are brought in as well as goal completions, or any other combination.

Well there you have it! Hope this was helpful to you. If you have any other questions you can comment below or find me on Twitter @ianpfister. Happy reporting!


To help us serve you better, please consider taking the 2020 Moz Blog Reader Survey, which asks about who you are, what challenges you face, and what you’d like to see more of on the Moz Blog.

* Checkbox GDPR is required

*

I agree

Will you like to book a consultation today?

We promise you’ll be glad to have us as the only premium website developer you’ve ever had!

Will you like to book a consultation today?

We promise you’ll be glad to have us as the only premium website developer you’ve ever had!

Bear Design - WordPress Development

Bear Design provides website development and design, creating content uploaded websites and improving web page placements and web traffic. Bear Design websites are unique, easy to use and responsive. Site owners can easily edit the content, or can trust the Bear Design & Communications to keep them up to date and supply quality content regularly.


GET IN TOUCH
160 City Road, EC1V 2NX London, United Kingdom
Monday – Thursday: 9:00 AM – 5:00 PM
Friday: 9:00 AM – 2:00 PM

WE ARE IN LONDON

Bear Design - WordPress Development

Bear Design provides website development and design, creating content uploaded websites and improving web page placements and web traffic. Bear Design websites are unique, easy to use and responsive. Site owners can easily edit the content, or can trust the Bear Design & Communications to keep them up to date and supply quality content regularly.


WE ARE IN LONDON

GET IN TOUCH
160 City Road, EC1V 2NX London, United Kingdom
Monday – Thursday: 9:00 AM – 5:00 PM
Friday: 9:00 AM – 2:00 PM

Bear Design - WordPress Development

Bear Design provides website development and design, creating content uploaded websites and improving web page placements and web traffic. Bear Design websites are unique, easy to use and responsive. Site owners can easily edit the content, or can trust the Bear Design & Communications to keep them up to date and supply quality content regularly.


GET IN TOUCH
160 City Road, EC1V 2NX London, United Kingdom
Monday – Thursday: 9:00 AM – 5:00 PM
Friday: 9:00 AM – 2:00 PM

WE ARE IN LONDON

© Made with by Bear Design

© Made with by Bear Design

    We are Bear Design

    WE DESIGN

    YOUR WORLD

    Bear Design & Communications Ltd.

    Address : 160 City Road, EC1V 2NX London, United Kingdom
    Phone : +36 702 448 100
    Email : [email protected]

    Opening hours :
    Monday – Thursday: 9:00 AM – 5:00 PM
    Friday: 9:00 AM – 2:00 PM

    Are you sure?
    You must approve our cookie policy to use our site. I you refuse it you will redirect to the Google.
    Refuse
    Approve Cookies
    Cookie Policy
    Cookie Policy
    This Bear Design Cookie Policy (“Policy”) outlines the general policy, practices, and types of cookies that Bear Design And Communications Ltd.. (“Bear Design”, “we”, “us” or “our”) may use to improve our services and your experience when visiting our websites.Cookies are small pieces of text used to store information on web browsers. They’re used by many websites to store and receive identifiers and other information on devices, such as a handheld phone or computer. Our site and services use cookies and other similar technologies (collectively in this Policy, “cookies”), in order to provide a better service to you and to generally improve our sites and services. For example, we may use cookies to help direct you to the appropriate part of our websites, by indicating that you are a repeat visitor. We may also use information to present you with services that are matched to your preferences.Some portions of our websites are functional without cookies, and you may generally choose whether to accept cookies. Most web browsers are set to accept cookies by default, however, you may be able to delete cookies yourself through your browser’s cookie manager. To do so, please follow the instructions provided by your web browser. Please note that disabling cookies will reset your session, disable auto-login, and may adversely the availability and functionality of our websites and the services we can provide to you.As part of our services, we may also place cookies on the computers of visitors to websites protected by Bear Design. We do this in order to identify malicious visitors, reduce the chance of blocking legitimate users, and to provide customized services.Our websites use first party cookies (i.e., cookies set directly by Bear Design) as well as third party cookies, as detailed in the table below.
    Type of CookieWhy we use these cookiesWho serves them and where can you find out more information?
    Analytics and research of usersThese are used to understand, improve, and research users visiting //beardesign.me and their needs for our product offerings. For example, we may use cookies to understand what pages a user browses before submitting a sales request form. We do not share information about this analysis with any third parties.Selected third parties listed and defined as follows:
    • Google Analytics – Web traffic tracking – //www.google.com/policies/privacy/
    • Bing – Conversion tracking from Bing ads – https://advertise.bingads.microsoft.com/en-us/resources/policies/microsoft-bing-adsprivacy-policy
    • Doubleclick – Google advertising platform that analyzes browsing activity across website to establish user profile – //www.google.com/policies/technologies/ads/
    • Twitter – Analyzes browsing activity across website to establish user profile – https://support.twitter.com/articles/20170514
    • Facebook – Analyzes browsing activity across website to establish user profile – https://www.facebook.com/policies/cookies/
    A user can delete these cookies through browser settings.
    Improving Website experienceThese provide functionality to help us deliver a better user experience for our website. For example, cookies help facilitate chats with our sales representatives, allow you to search the website, and deliver the user quickly to their intended website location.1st party and selected third parties as defined below:
    • __cfduid 3rd party cookie – This cookie is strictly necessary for Cloudflare’s security features
    • __hssc Cookie for keeping track of sessions. This is used to determine if we should increment the session number and timestamps in the __hstc cookie. It contains: the domain, viewCount (increments each pageView in a session), session start timestamp. (Expires: 30 min)
    • __hssrc Whenever HubSpot changes the session cookie, this cookie is also set. We set it simply to the value “1”, and use it to determine if the user has restarted their browser. If this cookie does not exist when we manage cookies, we assume it is a new session. (Expires: None. Session cookie)
    • __hstc The main cookie for tracking visitors. It contains: the domain, utk (see below), initial timestamp (first visit), last timestamp (last visit), current timestamp (this visit), and session number (increments for each subsequent session) (Expires: 2 years)
    • hsfirstvisit This cookie used to keep track of a user’s first visit. (Expires: 10 years)
    • hubspotutk This cookie is used for to keep track of a visitor’s identity. This cookie is passed to HubSpot on form submission and used when deduplicating contacts. (Expires: 10 years)
    • wordpress_ WordPress cookie for a logged in user.
    • wordpress_logged_in_ WordPress cookie for a logged in user.
    • wp-settings- WordPress also sets a few wp-settings-[UID] cookies. The number on the end is your individual user ID from the users database table. This is used to customize your view of admin interface, and possibly also the main site interface.
    • wp-settings-time- WordPress also sets a few wp-settings-{time}-[UID] cookies. The number on the end is your individual user ID from the users database table. This is used to customize your view of admin interface, and possibly also the main site interface.
    • __cfduid 3rd party cookie – This cookie is strictly necessary for Cloudflare’s security features
    A user can delete these cookies through browser settings.
    LAST UPDATE: 24.01.2018, LONDON
    Approve
    Refuse
    Welcome
    We use cookies to ensure that we give you the best experience on our website. Before you continue browsing you must approve or refuse our cookie policy.
    Approve
    Refuse
    Cookie Policy